
The dashboard presents visualizations and analysis of Fitbit fitness and health tracking data collected from my Fitbit Charge 4 from November 1, 2021 to March 3, 2022. While I started creating it because I wanted to know whether there were any relationships between fitness and health metrics, it later became an exercise in creating a dashboard that not only presented data summaries but aimed to present data purposefully.
To this end, the purpose of this dashboard is to recommend directions for new product features based on the insights derived from the data. The target audience for this dashboard would be those involved in product development or marketing and stakeholders of the Fitbit app and premium subscription service.
See the interactive Google Sheets dashboard here.
Note: As this analysis was only on data from one individual (me) and over a period of only four months, it should go without saying that real business recommendations should come from a richer corpus of data.
Background
The Fitbit app and Fitbit Premium subscription service form an integrated health platform. The Fitbit app collects data from Fitbit’s wearables, providing metrics on physical activity, sleep, heart rate, and nutrition. Fitbit Premium enhances the user experience with personalized health reports and advanced insights. Together, they embody Fitbit’s mission to inspire healthier lifestyles through actionable data and insights.
(Mock) Problem Statement
Fitbit is looking for new ways to increase engagement of users through actionable data and insights. They believe that it is possible by looking at the existing data at a different angle, with a different lens.
Business Task
1. Analyze and visualize data to better understand user fitness and health behaviors and to explore new angles.
2. Recommend areas that can be used by product development or product marketing
Dashboard
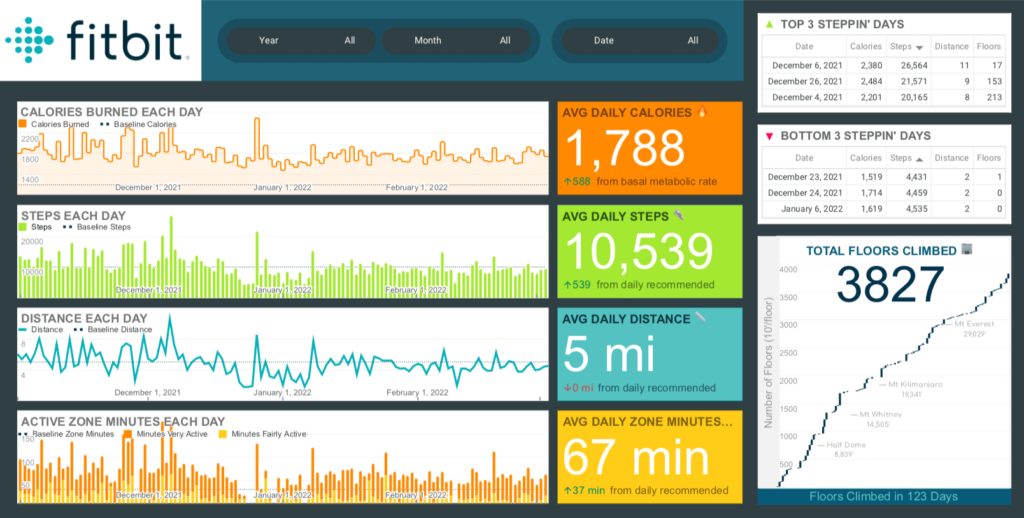
The “at-a-glance” dashboard presents Fitbit data in a way that can be quickly consumed by the dashboard user, as well as allow for a deeper dive from different views.
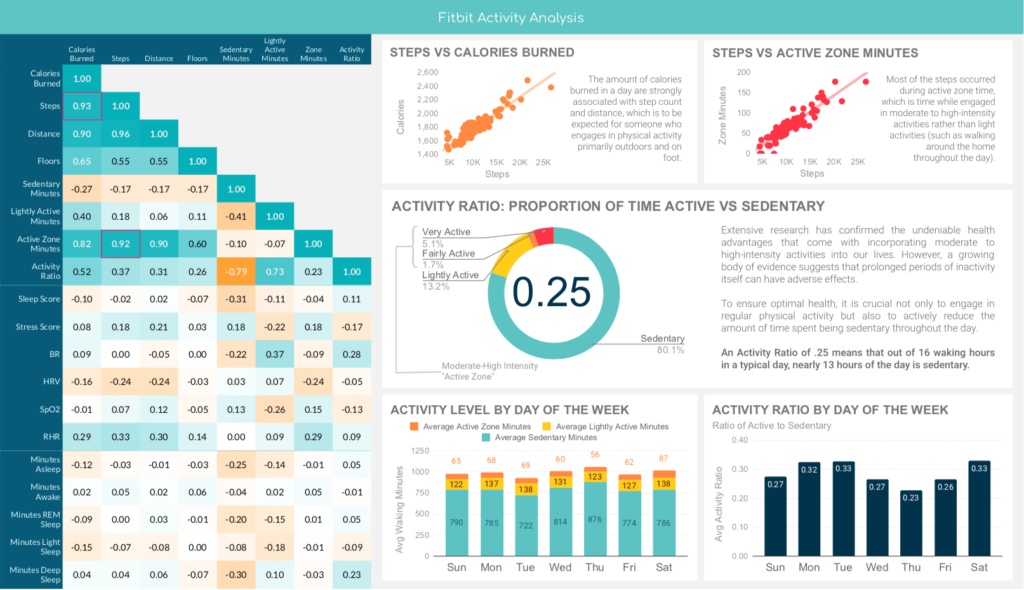
The Fitbit activity analysis revealed that this Fitbit user burns most of their calories through step-based activities. Moreover, their steps coincide with active zone minutes, which indicates that most steps happen during sessions of moderate to high-intensity activities rather than sporadically throughout the day. While this Fitbit user regularly engages in rigorous physical activity, the rest of the time is predominantly sedentary.
Recommendation: Research shows that decreasing sedentary time may be just as important to health as engaging in physical activity. Consider personalized coaching with concrete goals that fits to individual’s lifestyle.

The sleep analysis for this Fitbit user shows relationships between stress, REM, deep sleep, and to a lesser extent light sleep, with the Fitbit sleep quality score.
Recommendation: As part of the advanced analytics service, encourage good sleep behaviors by highlighting the specific effects of good/poor sleep. Focus on the link between sleep and stress, as that makes keeping good sleep hygiene more concrete for the user.