Originally answered on Quora: What is an intuitive explanation for PCA?
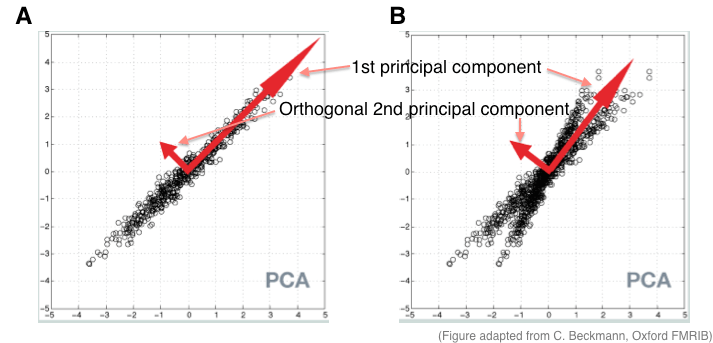
For 2-dimensional data sets (i.e., two feature variables), principal component analysis (PCA) first finds the relationship between the two features. The figure above shows this relationship for two separate samples of data by plotting each one on a separate axis (Panel A and B). To illustrate the behavior of PCA with imperfect data, the example in Panel A is Gaussian distributed, whereas Panel B is non-Gaussian.
Since the data is 2D, we want to draw a single 2D ellipse that best fits around all the data. The process of “fitting” this ellipse is called data rotation in PCA. The entire data is rotated in space so that their mass fits along the two axes of an ellipse:
Note that we rotate the data rather the ellipse because we want to be able to describe the data points with respect to its new axes. Data along the major axis contributes to the 1st principal component and data along the minor axis contributes to the 2nd principal component (which we’re usually not interested in if the goal is dimensionality reduction). The length of each axis reflects the total variance captured by that component, aka the eigenvalues of PCA. The eigenvector of the first principal component is thus the 1D representation of the location of the data points along the largest axis.
This basic idea can be carried out with data in N-dimensional space. For example, when the data is 3D, an ellipsoid is used to capture the data cloud. As there are three axes in an ellipsoid, there will be three principal components.